Building Profiles in the Additive Print Services Market – Market Research Beyond AI Scraping


New market research: AM Research is building its new Additive Manufacturing Services Market 2.0 model. View the report and preorder here →
In case you haven’t heard, at Additive Manufacturing Research (AM Research) we’re tackling a new research project to model the AM services market, because service providers are really what’s moving the AM market in the current age of supply chain shakeups and critical, fast-moving manufacturing initiatives in defense, energy, and aerospace.
You can read all about the ideas and trends behind our upcoming AM service market report and model building in our first article here.
With AI becoming a widely used tool for what I would call directional research, we promised to give our readers and customers a look under the hood of our research techniques in the additive market, to show that there’s a lot more to consider when strategizing around additive markets than just an AI scrape. In this article, we’ll walk through some of the key modeling components our new services market model is built on, especially the competitor profiles that drive the model. The very first profile we’re building out as we develop the model is one you’ll know well – Materialise.
Why Materialise is the Perfect Starting Point for the New Model
Our “Services Market 2.0” market model is very different from how we currently track and model AM print services in our quarterly market advisories. Our last article described some of these differences in detail, but if you haven’t read it, know that in the 2.0 model we’re focusing our efforts similarly to how we model the rest of the industry. We develop a methodology that lets us profile the companies driving the segment in question (print services, in this case), then fill those profiles with deep-dive research specific to each player.
Materialise is as close to a ‘pure-play’ additive company as you can get at its current size, and because it has been a publicly traded company for many years, there is ample publicly available data to check our more detailed analysis against.
This brings up the first point I want to highlight in our research offerings about specialization and detail. AI can pull together lots of data from other sources, such as a public company’s annual 10-K filings, and present information from that source data. We use AI here to do that for us to save time. Our market models are designed to tie together lots of data and research points in a logical way to get to the deeper meaning, answer ‘why’ the source data is what it is, and then project how that same data might look in the future.
We can treat our modeling activities as aiming at a target. In this metaphor, we have to know what the target is in the first place, and this is why Materialise is a great starting point, because we have semi-detailed revenue reports from many years to ‘aim’ the models at. The model methodology is sort of like the “gun,” which allows us to even attempt to hit the target, but we have to make adjustments to the workings of the model to actually make sure we hit the target, similarly to how a marksman might have to adjust the settings on his scope to know the trajectory of the projectile that comes out of the barrel.
Walking Through the Logic of the Services 2.0 Model
We model competitive profiles of AM print service bureaus and then aggregate them to create the total market picture in our upcoming Services 2.0 model. In the case of Materialise, the first profile we are building out using the methodology, we begin with reports from the company over the years regarding how many printers it owns and operates. This is the starting point for all profiles in the model. Many providers in the contract manufacturing space provide information on the machines they use and operate, and although not every company provides a detailed mapping of exactly what printers they own and use, in many cases it is in the service provider’s best interest to report this information to attract the right customers.
With an annual mapping and forecast of printers by the core eight print processes, we can model their utilization and resulting cubic-inch output of available material. This is similar to work AM Research has done tracking the additive hardware and materials market, with the goal of creating a detailed materials consumption map for a given company. However, instead of the goal being how much material is being used for material sales tracking, we’re modeling the cubic inch output of printed material (i.e., parts) through this method.
Because we track service bureau machines by technology type, we estimate how much polymer powder, metal powder, UV curable, jetted UV resin, and plastic filament their operations turn into parts.
From this point, we then split the consumed materials from the parent processes into more specific material subtypes. For example, from the printed cubic inches of powder from powder bed fusion machines, we split that total amount across all printers into categories like PA12, PA11, elastomers, polypropylene, and others. We do this by reviewing applications that a company may be known for. In the case of Materialise, both PA12 and PA11 are estimated to be high percentages of overall material use thanks to patient-specific cutting guides (PA12) and eyewear frames (PA11).
Now, with a mapping of Materialise’s detailed printed cubic inch output across its various operations, it’s time to prescribe a new special modeling layer – revenue per cubic inch of output material. Because we have split service provider output into semi-detailed material types, the model can account for the factors that affect quoting and pricing parts made by different print technologies, as well as different material types within each that may require special considerations, such as different post-processing requirements, different print speeds, and so forth.
The decision to create the Services 2.0 model based on a revenue-per-cubic-inch methodology was partly driven by the evolution of the print services software segment, where there have been major strides in developing automatic quoting tools. There is an increasing amount of information related to printer return on investment available for us to create these models from. Utilizing this approach, we take the detailed cubic inch material mapping for each vendor, and then generate a revenue map for parts printed.
The final step estimates which regions and end-user markets are driving that revenue. In the case of Materialise or other publicly traded companies, regional breakouts are often simply a matter of collecting data. We determine the end-user industry split through the specific deep-dive research process for each competitor profiled in the model.
The visualization below summarizes the logical flow of the Services 2.0 model.
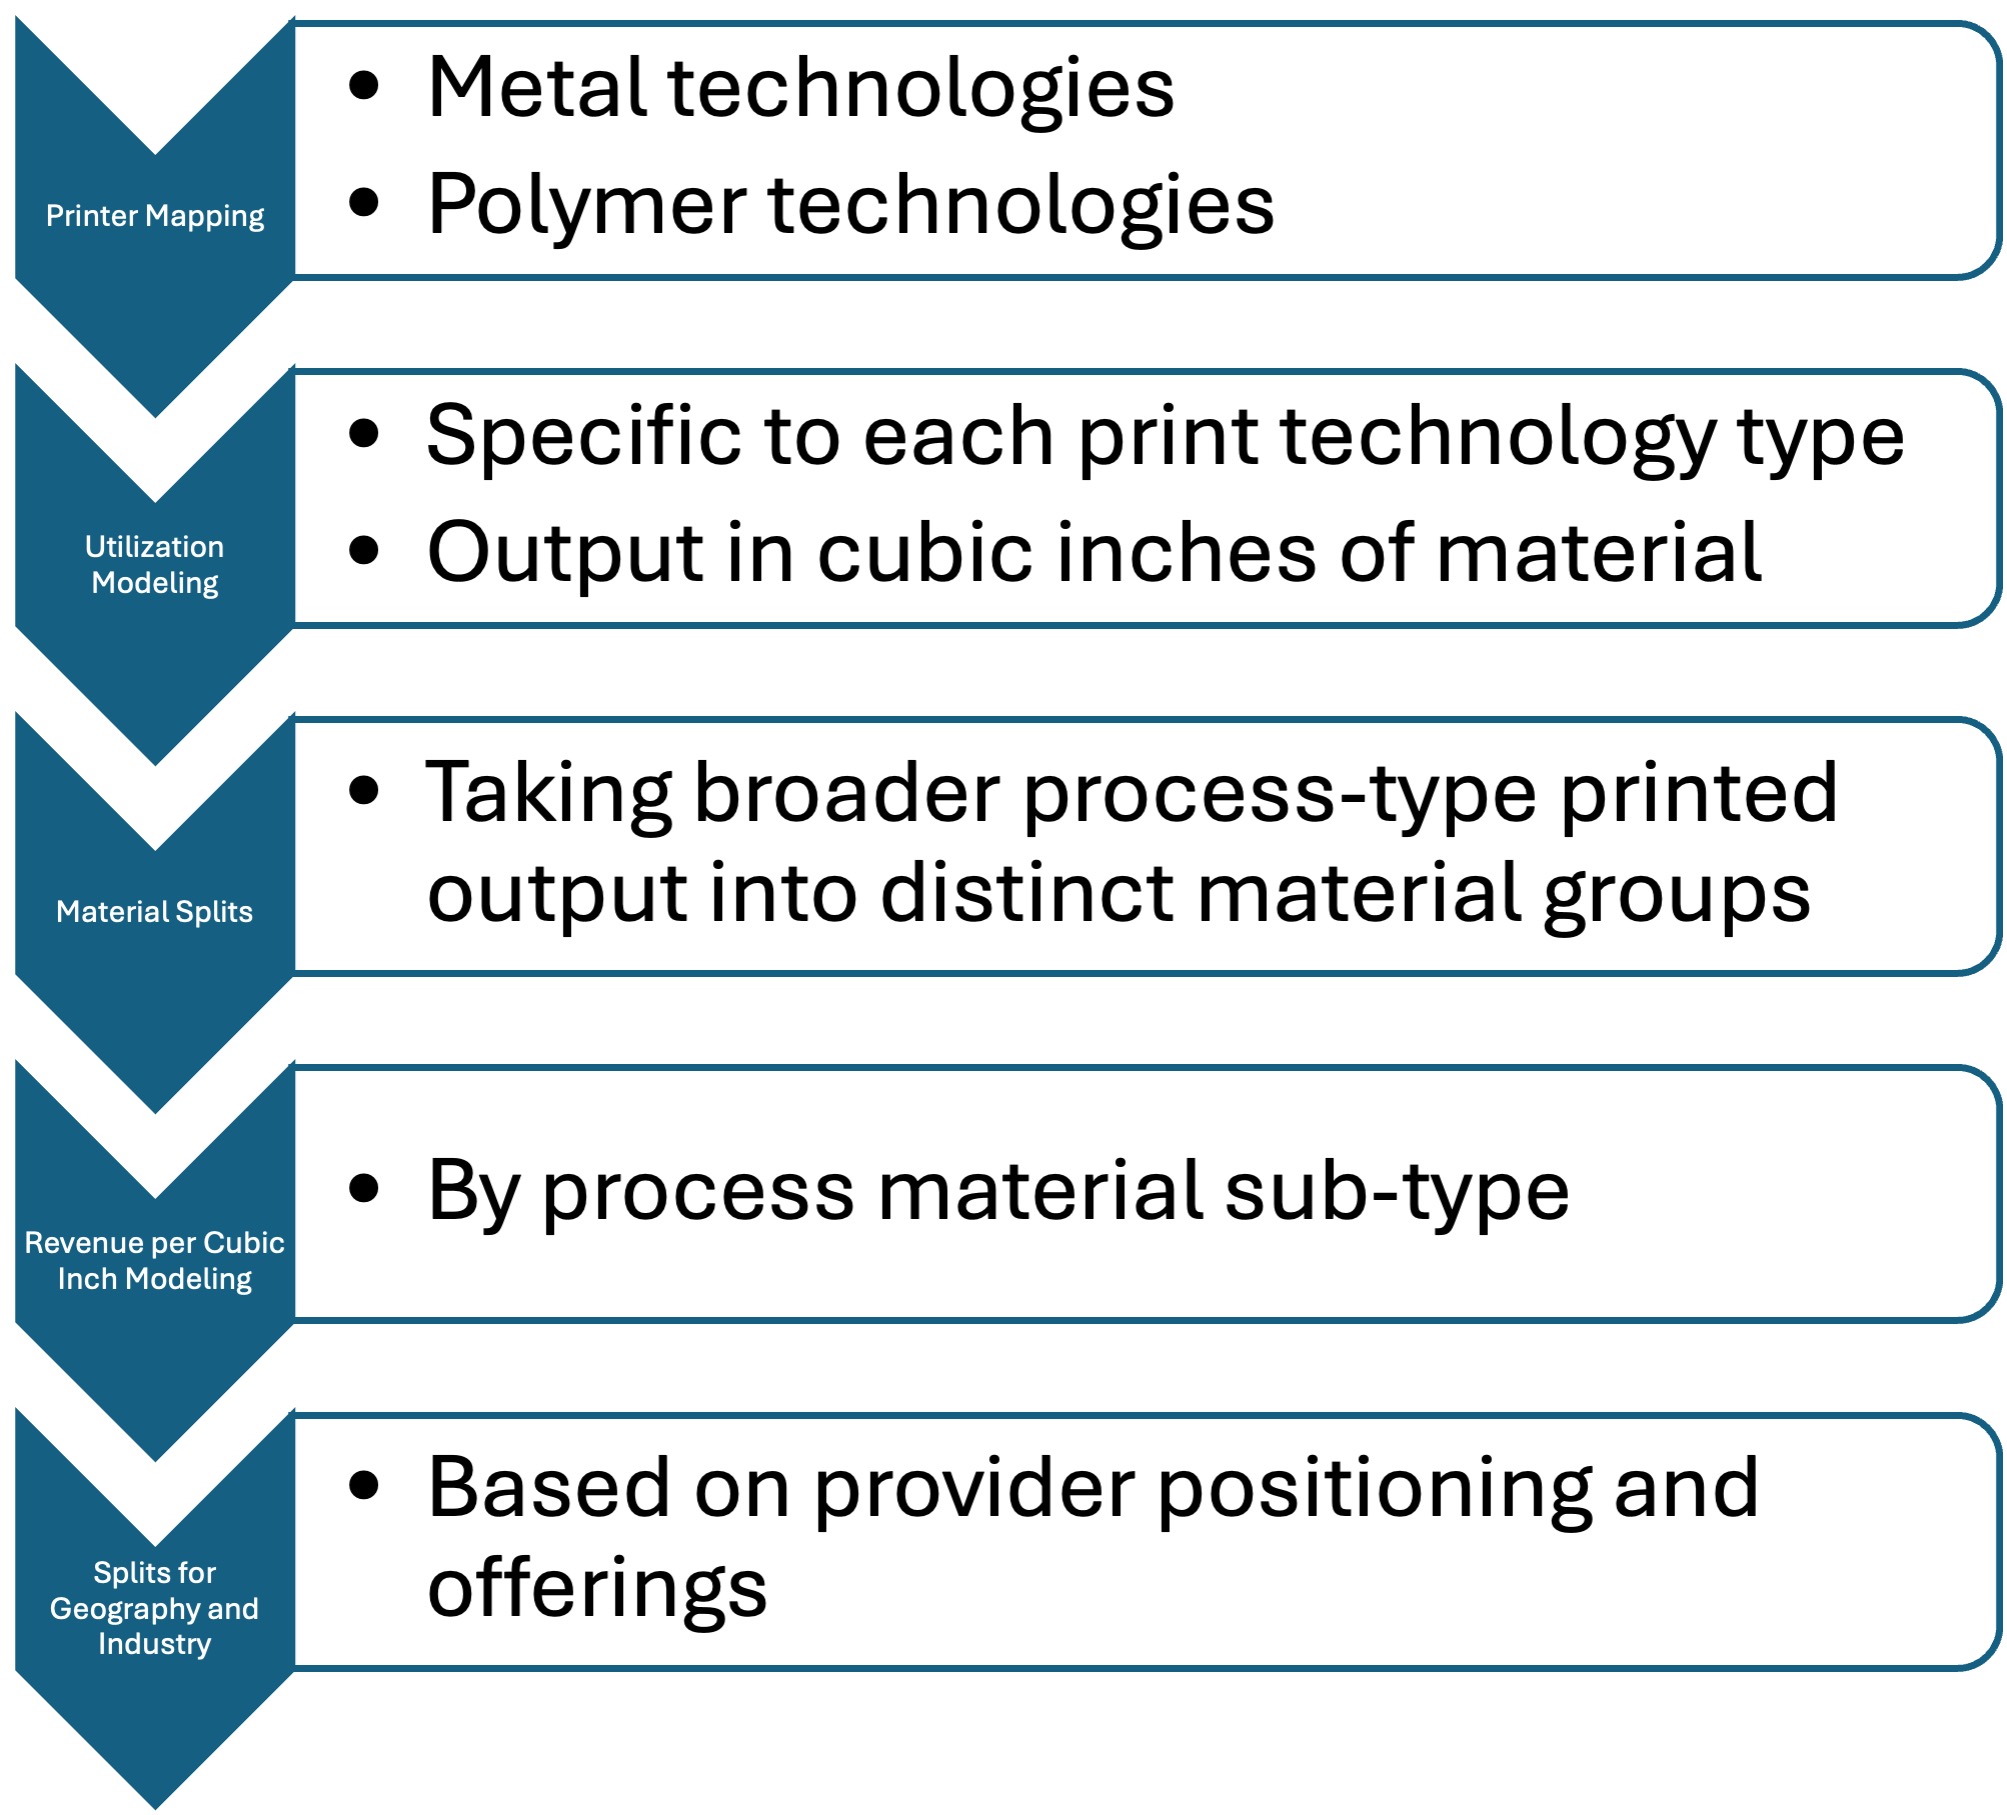
Visualization summarizing the logical flow of the Services 2.0 model. Image courtesy of AM Research.
Why We Think This Approach Works for AM Print Services
We are excited about our new Services 2.0 model for the additive print services market for several reasons. We believe this methodology lets us better represent the overall market by not only reporting revenues by end-user industry and geography, but also adding depth and accuracy through technology- and provider-specific modeling.
For example, an increasing number of additive print services providers have developed their own ‘flavor’ of in-house print technology, with the goal of selling the parts they make rather than selling machines. With this model, we can account for the nature of each entity’s technology and how it is leveraged and positioned, rather than trying to adapt it to a traditional service bureau model.
In addition, we can now use some of the industry’s work on optimizing print services for profitability through software models that can more easily and accurately quote the cost of print jobs to the end customer.
These and other tenets of this project highlight what we believe is an important distinction in the age of AI – if you don’t understand the details behind the data, then the data cannot ultimately be useful beyond acting as the basis for more research. Detailed, specialized market research can both explain the details behind the data and provide an outlet for outsourcing further research to drill down beyond scraping. Now, AI tools can make these research processes more efficient and, therefore, more accurate and in-depth in the hands of someone who understands an industry in its entirety. This is the role we seek to play at AM Research going forward, and our Print Services 2.0 market modeling project is one of the first efforts to reflect this positioning.
Building Out the Model for You
We still have plenty of work to do to build out our new model of the print services industry in its entirety. If you are a stakeholder in the print services market or a provider of such services, we’d encourage you to reach out to us now to engage – we can learn from you to make our model better, but we can also help aim it at answering your questions about the services market. If you would like to gain access to the final report and model data when it is released, please contact us, especially before the discount level changes on October 1st, 2026!
AM Research is currently building its new Services Market 2.0 model, with the final report and model data expected later this year.
Print service providers and other industry stakeholders interested in contributing to the research are encouraged to contact AM Research here: info@additivemanufacturingresearch.com
Preorder by 11:59 PM on October 1 to receive the current discounted rate. After that, the preorder price increases.
View the Additive Manufacturing Services Markets 2026–2035 report and preorder →
Subscribe to Our Email Newsletter
Stay up-to-date on all the latest news from the 3D printing industry and receive information and offers from third party vendors.
Print Services
Upload your 3D Models and get them printed quickly and efficiently.













You May Also Like
Creality K3 Opens for Pre-Order at $849, Advancing Multi-Color 3D Printing
Creality has officially opened pre-orders for the Creality K3, its latest flagship K Series 3D printer, starting at $849 in the United States. Recognized as an IFA Innovation Awards 2026...
Prusa Core One L+: A Worthy Upgrade?
Disclosure: The Core One L+ was provided to me by Prusa3d free of charge for the purpose of this review. I have not received any other compensation. All opinions expressed...
Prusa Upgrades Its Lineup with CORE One+ (Gen 2), CORE One L+, and XL+
Prusa Research has updated its high-end desktop 3D printer lineup. The company is offering new and improved versions of the machines it targets at industrial and power users, with the...
Zaha Hadid Architects Print 6M Model with WASP’s Robotic Arm Solutions
Zaha Hadid Architects (ZHA) have successfully used WASP 3D printers to make a 6-meter-tall model of an aircraft control tower. Zaha Hadid Architects’ Tech Lab made the tower in-house for the ZHAviation...