Q1 2016 Financial Results Just Released for Materialise


 Overall, when it comes to discussing projections for the 3D printing industry, we hear that the dollar signs should be plentiful indeed as we ring in many more new years, new products, and new materials. The subject can become confusing though when we see large companies though like 3D Systems and Stratasys showing numbers that range from terrible to less than stellar.
Questions abound as to why the larger companies aren’t holding it together more lucratively, but such is the way of big business and an ever changing and extremely competitive marketplace, with shakeups internally always causing upheaval, even if temporarily. Materialise, with Q1 2016 results just released, now demonstrates revenues in line with the Street estimate, although with a greater net loss than expected.
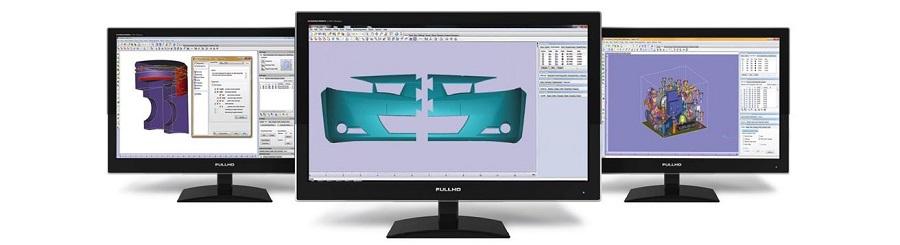
Materialise Magics Software
The Belgium-headquartered company shows that for the first quarter ending March 31, 2016, there were indeed numerous increases, to include the following:
- Total revenue increase of 14.2% from the first quarter of 2015 to 26,667 kEUR. This is up from 23,348 kEUR for the first quarter of 2015, driven by gains in all three of Materialise’s segments.
- Adjusted EBITDA (earnings before interest, taxes, depreciation, and amortization) rose to 1,135 kEUR from (288) kEUR for the first quarter of 2015. This is seen as a result of combined and continued revenue growth, with operational expenses increasing only slightly. The Adjusted EBITDA margin in the first quarter was 4.3% compared to (1.2)% in the first quarter of last year.
- Total deferred revenue from annual software sales and maintenance contracts increased 1,731 kEUR from 12,231 kEUR for the first quarter of 2015 to 13,962 kEUR for the first quarter of 2016.
- Materialise Software revenue was up 21.5% from the first quarter of 2015. This proprietary software enhances hardware around the globe, and has certainly been a boon for the company, all due to continued revenues, increasing and generated by OEMS, as well as steadily growing income from recurring licenses. Segment EBITDA increased to 2,765 kEUR from 2,215 kEUR while the segment EBITDA margin rose to 37.2% from 36.2% in the prior-year period.
- Materialise Manufacturing revenue was up 13.0% from the first quarter of 2015. Featuring an integrated suite of both 3D printing and engineering services for customers in the industrial/commercial sector, this increase was up to 10,606 kEUR for the first quarter of 2016 from 9,384 kEUR for the first quarter of 2015. The company sees this as a result of higher end part manufacturing.
- Segment EBITDA rose to 257 kEUR from (40) kEUR while the segment EBITDA margin increased to 2.4% from (0.4)% for the 2015 quarter. Excluding the company’s growth businesses, i.materialise and RapidFit, the segment EBITDA margin for the first quarter was 9.7% as compared to 10.0% for the same quarter of the prior year.
Peter Leys, Materialise Executive Chairman
“In the first quarter, we continued to execute on our strategy of strengthening Materialise’s position as a leading enabler of 3D printing applications and performed in line with our expectations. Revenue rose 14.2% and Adjusted EBITDA increased from (288) kEUR to 1,135 kEUR,” states Executive Chairman Peter Leys.
“In Materialise Software, we have been taking the final steps to launch our Magics 3D Print Suite, supporting our positioning as the backbone of industrial 3D Printing. In Materialise Medical, we launched our Mimics Care Suite, designed to accelerate the integration of certified medical 3D printing within hospitals. In Materialise Manufacturing, we have been making progress in establishing partnerships with market leaders to further our goal of participating in meaningful end part manufacturing projects.”

Gross profit was 15,962 kEUR, or 59.9% of revenue, for the first quarter of 2016 compared to 13,467 kEUR, or 57.7% of revenue, for the first quarter of 2015, resulting from a continued shift of a revenue mix towards both industrial and medical software licenses as well as an improvement of the gross margin of the Materialise Manufacturing segment.
According to Materialise, research and development, sales and marketing, and general and administrative expenses increased, in the aggregate, by 5.4% to 18,237 kEUR from 17,297 kEUR for the first quarter of 2015. While R&D expenses remained relatively stable, moving from 4,507 kEUR to 4,372 kEUR, S&M expenses decreased modestly from 9,215 kEUR to 8,815 kEUR, and G&A expenses increased from 3,575 kEUR to 5,050 kEUR. Materialise sees these changes as a result of new managerial ‘structure and support’ that’s been implemented over the past 18 months in both R&D and S&M—and indeed, these have been put in place due to significant growth requiring greater resources.
“A number of employees with mixed roles within these groups have evolved into more managerial/administrative roles, and their cost as well as certain other expenses are now categorized into G&A,” states the company.
In terms of decreases and losses, Materialise reported the following:
- Net other operating income decreased by 494 kEUR to 1,286 kEUR, compared to 1,780 kEUR for the first quarter of 2015. This income consists primarily of withholding tax exemptions for qualifying researchers, development grants, partial funding of R&D projects and currency exchange results on purchase and sales transactions. Materialise explains the decrease versus last year as primarily due to the variance in the currency exchange effect, resulting in a loss of (48) kEUR from a gain of 493 kEUR in the same period last year.
- Net financial result was (734) kEUR, compared to 1,472 kEUR for the prior-year period, reflecting the variance in the currency exchange rate, primarily on the portion of the company’s IPO proceeds held in U.S. dollars versus the euro, a reported but mostly unrealized exchange loss.
- Net loss for the first quarter of 2016 was (3,151) kEUR, compared to a net loss of (888) kEUR for the same period in the prior year, as a result of an increase of income tax by (1,010) kEUR (primarily due to the usage of a deferred tax asset) and a decrease of their net financial result by (2,206) kEUR, which were partially offset by an improvement of operating profit by 1,061 kEUR.
- Total comprehensive loss for the first quarter of 2015, which reflects exchange differences on translation of foreign operations, was (4,115) kEUR compared to a gain of 425 kEUR for the same period in the prior year.
As of March 31, 2016, the company had cash and equivalents of 49,435 kEUR compared to 50,726 kEUR at December 31, 2015. Cash flow from operating activities in the first quarter of 2016 was 1,376 kEUR. Net shareholders’ equity at March 31, 2016 was 79,028 kEUR, a decrease of 3,927 kEUR since December 31, 2015.
The stock increased 1.85% or $0.12 on May 10, hitting $6.87.
2016 Guidance from Materialise is as follows:
“As detailed in the company’s year-end fiscal 2015 earnings announcement, in fiscal 2016 management expects to report consolidated revenue between 115,000 – 120,000 kEUR and Adjusted EBITDA between 7,000 – 9,000 kEUR. Management also expects the amount of deferred revenue the company generates from annual licenses and maintenance to increase by an amount between 3,000 – 4,000 kEUR from 13,136 kEUR as of December 31, 2015.”
A conference call regarding financial results for Q1 was held this morning at 8:30 a.m., with the following participating: Wilfried Vancraen, Founder and Chief Executive Officer; Peter Leys, Executive Chairman; and Johan Albrecht, Chief Financial Officer. If you are interested in hearing a replay of this, you may gain access by dialing 855-859-2056 (international participants should dial 404-537-3406). The access code for the replay is #88439870. Materialise states that a webcast of the conference call and slide presentation will be archived on the company’s website for one year.
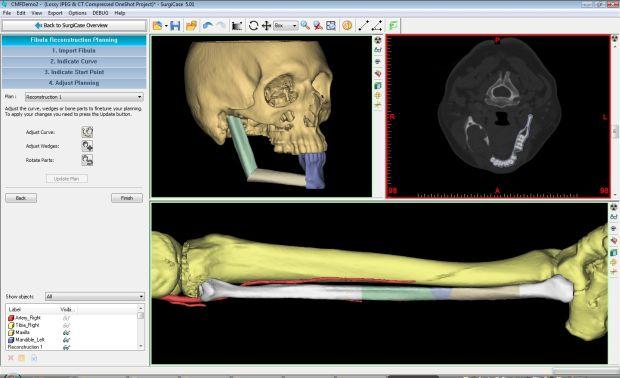 Materialise, although headquartered in Belgium, is a company that has been in business for over 25 years, and is respected worldwide. Known for their software development, as well as one of the largest printing facilities, we follow their activities continually, with an emphasis on their contributions to the medical sector, from helping to create the world’s first 3D printed wheelchair to their ongoing work in offering superior software, which has been responsible for assisting in cases such as that of an innovative and successful jaw replacement surgery.
Unless otherwise noted, all translations from euros to US dollars were made at a rate of EUR 1.00 to USD 1.1385, the 12:00 noon ET buying rate of the Federal Reserve Bank of New York for the euro on March 31, 2016. Did you see any surprises here? Discuss in the Materialise Q1 2016 Financial Report forum over at 3DPB.com.
[Sources: Business Wire; Sonoran Weekly Review ]|
Consolidated income statements (Unaudited) |
||||||||||||||||
| For the three months ended March 31 | ||||||||||||||||
|
2016 |
2016 |
2015 |
||||||||||||||
|
(In thousands, except EPS) |
U.S. $ |
€ |
€ |
|||||||||||||
| Revenue | 30,360 | 26,667 | 23,348 | |||||||||||||
| Cost of Sales | (12,188) | (10,705) | (9,881) | |||||||||||||
| Gross Profit | 18,172 | 15,962 | 13,467 | |||||||||||||
| Research and development expenses | (4,978) | (4,372) | (4,507) | |||||||||||||
| Sales and marketing expenses | (10,036) | (8,815) | (9,215) | |||||||||||||
| General and administrative expenses | (5,749) | (5,050) | (3,575) | |||||||||||||
| Net other operating income (expenses) | 1,464 | 1,286 | 1,780 | |||||||||||||
| Operating (Loss) Profit | (1,127) | (989) | (2,050) | |||||||||||||
| Financial expenses | (1,021) | (897) | (449) | |||||||||||||
| Financial income | 186 | 163 | 1,921 | |||||||||||||
| Share in loss of a joint venture | (191) | (168) | (60) | |||||||||||||
| Profit before taxes | (2,153) | (1,891) | (638) | |||||||||||||
| Income Taxes (benefit) | (1,435) | (1,260) | (250) | |||||||||||||
| Net profit (loss) | (3,588) | (3,151) | (888) | |||||||||||||
| Net profit (loss) attributable to: | ||||||||||||||||
| The owners of the parent | (3,588) | (3,151) | (835) | |||||||||||||
| Non-controlling interest | – | – | (53) | |||||||||||||
| EPS attributable to the owners of the parent | ||||||||||||||||
| Basic | (0.08) | (0.07) | (0.02) | |||||||||||||
| Diluted | (0.08) | (0.07) | (0.02) | |||||||||||||
| Weighted average basic shares outstanding |
47,325 |
47,325 |
47,170 |
|||||||||||||
| Weighted average fully diluted shares outstanding |
47,325 |
47,325 |
47,170 |
|||||||||||||
|
Consolidated statements of comprehensive income (Unaudited) |
||||||||||
| For the three months ended March 31 | ||||||||||
|
(In thousands) |
2016 |
2016 |
2015 |
|||||||
|
U.S. $ |
€ |
€ |
||||||||
| Net profit (loss) for the year | (3,588) | (3,151) | (888) | |||||||
| Other comprehensive income | ||||||||||
| Exchange differences on translation of foreign operations | (1,098) | (964) | 1,313 | |||||||
| Other comprehensive income (loss), net of taxes | (1,098) | (964) | 1,313 | |||||||
| Total comprehensive income (loss) for the year, net of taxes | (4,686) | (4,115) | 425 | |||||||
| Total comprehensive income (loss) attributable to: | ||||||||||
|
The owners of the parent |
(4,686) |
(4,115) | 478 | |||||||
|
Non-controlling interest |
– |
– |
(53) |
|||||||
|
Consolidated statements of financial position (Unaudited) |
|||||||
|
(in thousands of euros) |
|||||||
| As of
March 31, |
As of |
||||||
| 2016 | 2015 | ||||||
| Assets | |||||||
| Current assets | |||||||
| Inventory | 5,172 | 5,387 | |||||
| Trade receivables | 23,152 | 22,843 | |||||
| Other current assets | 4,981 | 4,993 | |||||
| Held to maturity investments | – | – | |||||
| Cash and cash equivalent | 49,435 | 50,726 | |||||
| Total current assets | 82,740 | 83,949 | |||||
| Non-current assets | |||||||
| Goodwill | 9,269 | 9,664 | |||||
| Intangible assets | 9,059 | 9,657 | |||||
| Property, plant & equipment | 38,102 | 38,400 | |||||
| Investments in joint ventures | 850 | 1,018 | |||||
| Deferred tax assets | 109 | 1,092 | |||||
| Other financial assets | 323 | 356 | |||||
| Total non-current assets | 57,712 | 60,187 | |||||
| Total assets | 140,452 | 144,136 | |||||
| Equity and liabilities | |||||||
| Current liabilities | |||||||
| Loans & borrowings | 4,137 | 4,482 | |||||
| Trade Payables | 8,470 | 9,712 | |||||
| Tax Payables | 495 | 255 | |||||
| Deferred income | 18,116 | 16,509 | |||||
| Other current liabilities | 9,252 | 9,212 | |||||
| Total current liabilities | 40,470 | 40,170 | |||||
| Non-current liabilities | |||||||
| Loans & borrowings | 16,605 | 16,607 | |||||
| Deferred tax liabilities | 1,953 | 2,068 | |||||
| Deferred income | 65 | 92 | |||||
| Other non-current liabilities | 2,331 | 2,244 | |||||
| Total non-current liabilities | 20,954 | 21,011 | |||||
| Net equity | |||||||
| Share capital | 2,729 | 2,729 | |||||
| Share premium | 78,284 | 78,098 | |||||
| Consolidated reserves | (1,742 | ) | 1,407 | ||||
| Other comprehensive income (loss) | (243 | ) | 721 | ||||
| Equity attributable to the owners of the parent | 79,028 | 82,955 | |||||
| Non-controlling interest | – | – | |||||
| Total equity | 79,028 | 82,955 | |||||
| Total equity and liabilities | 140,452 | 144,136 | |||||
|
Consolidated cash flow statements (Unaudited) |
||||||
| (in thousands of euros) | For the three months ended | |||||
|
March 31, |
March 31, |
|||||
| Operating activities | ||||||
| Net profit (loss) for the period | (3,151) | (888) | ||||
| Non-cash and operating adjustments | ||||||
| Depreciation of property, plant & equipment | 1,448 | 1,219 | ||||
| Amortization of intangible assets | 462 | 323 | ||||
| Share-based payment expense | 214 | 220 | ||||
| Loss (gain) on disposal of property, plant & equipment | – | (111) | ||||
| Fair value adjustment contingent liabilities | – | – | ||||
| Movement in provisions and allowance for bad debt | 42 | (2) | ||||
| Financial income | (48) | (137) | ||||
| Financial expense | 254 | 240 | ||||
| Impact of foreign currencies | 528 | (2,024) | ||||
| Share of loss in a joint venture | 168 | 60 | ||||
| Deferred tax expense (income) | 868 | 171 | ||||
| Income taxes | 358 | 79 | ||||
| Other | – | (5) | ||||
| Working capital adjustments | ||||||
| Increase in trade receivables and other receivables | (285) | (1,364) | ||||
| Decrease (increase) in inventories | 215 | (775) | ||||
| Increase in trade payables and other payables | 421 | 3,988 | ||||
| Income taxes paid | (118) | (176) | ||||
| Net cash flow from operating activities | 1,376 | 818 | ||||
| Investing activities | ||||||
| Purchase of property, plant & equipment | (1,325) | (2,809) | ||||
| Purchase of intangible assets | (265) | (234) | ||||
| Proceeds from the sale of property, plant & equipment, net | 85 | 2,535 | ||||
| Acquisition of subsidiaries | – | (1,797) | ||||
| Investments in joint-ventures | – | (500) | ||||
| Investments in held to maturity investments | – | 3,000 | ||||
| Interest received | 3 | 49 | ||||
| Net cash flow used in investing activities | (1,502) | 244 | ||||
| Financing activities | ||||||
| Proceeds from loans & borrowings and convertible debt | 604 | 269 | ||||
| Repayment of loans & borrowings | (656) | (2,320) | ||||
| Repayment of finance leases | (419) | (342) | ||||
| Purchase of non-controlling interest | – | (1,377) | ||||
| Capital increase in parent company | – | 580 | ||||
| Interest paid | (141) | (137) | ||||
| Other financial income (expense) | (33) | (32) | ||||
| Net cash flow from financing activities | (645) | (3,359) | ||||
| Net increase of cash and cash equivalents | (771) | (2,297) | ||||
| Cash and cash equivalents at beginning of period | 50,726 | 51,019 | ||||
| Exchange rate differences on cash & cash equivalents | (520) | 1,849 | ||||
| Cash & cash equivalents at end of period | 49,435 | 50,571 | ||||
|
Segment P&L (Unaudited) |
||||||||||||||||||||||||
| (In thousands of euros, except percentages) |
Materialise |
Materialise |
Materialise |
Total |
Adjustments & |
Consolidated |
||||||||||||||||||
|
For the three month period ended March 31, 2016 |
||||||||||||||||||||||||
| Revenues | 7,431 | 8,606 | 10,606 | 26,643 | 24 | 26,667 | ||||||||||||||||||
| Segment EBITDA | 2,765 | (530 | ) | 257 | 2,492 | (1,571 | ) | 921 | ||||||||||||||||
| Segment EBITDA % | 37.2 | % | (6.2 | )% | 2.4 | % | 9.4 | % | 3.5 | % | ||||||||||||||
|
For the three month period ended March 31, 2015 |
||||||||||||||||||||||||
| Revenues | 6,116 | 7,848 | 9,384 | 23,348 | – | 23,348 | ||||||||||||||||||
| Segment EBITDA | 2,215 | (746 | ) | (40 | ) | 1,429 | (1,937 | ) | (508 | ) | ||||||||||||||
| Segment EBITDA % | 36.2 | % | (9.5 | )% | (0.4 | )% | 6.1 | % | (2.2 | )% | ||||||||||||||
|
Reconciliation of Net Profit/(Loss) to EBITDA and Adjusted EBITDA (Unaudited) |
|||
|
For the three months |
|||
| (in thousands of euros) | 2016 | 2015 | |
| Net profit/(loss) | (3,151) | (888) | |
| Income taxes | 1,260 | 250 | |
| Financial expenses | 897 | 449 | |
| Financial income | (163) | (1,921) | |
| Share in loss of a joint venture | 168 | 60 | |
| Depreciation & amortization | 1,910 | 1,542 | |
| EBITDA | 921 | (508) | |
| Non-recurring IPO expenses(1) | 0 | 0 | |
|
Non-cash stock-based compensation |
214 | 220 | |
| Adjusted EBITDA | 1,135 | (288) | |
(1) Non-recurring IPO expenses represent fees and costs incurred in connection with the company’s initial public offering.
(2) Non-cash stock-based compensation expenses represent the cost of equity-settled and cash-settled share-based payments to employees.
Subscribe to Our Email Newsletter
Stay up-to-date on all the latest news from the 3D printing industry and receive information and offers from third party vendors.
Print Services
Upload your 3D Models and get them printed quickly and efficiently.


You May Also Like
Australia’s AMCRC Funds Titanium 3D Printing R&D
In terms of the global economy’s presently existing state, there is no realistic path to economic resilience that doesn’t start with critical minerals security. This is a problem for pretty...
3DPOD 305: Automating AM with Grenzebach’s Oliver Elbert
Oliver Elbert‘s over ten years in additive manufacturing have been spent automating LPBF. For large, high-volume, or critical parts, Grenzebach has provided custom automation solutions. Depowdering, powder handling, sieving, heat...
AMPulse Asia: Chinese IPOs, Defense Deals, and Dental 3D Printing Lead APAC Roundup
The second half of June brought a wave of additive manufacturing activity across China, Japan, South Korea, India, and Australia. From Chinese IPOs and funding rounds to defense, aerospace, construction,...
Austal, Curtin University and AMCRC Work on R&D Together
Australia’s Additive Manufacturing Cooperative Research Centre (AMCRC) works with 70 industry partners to deliver collaborative R&D projects. They also work on workforce development and technology transfer. It’s kind of analogous...