Stratasys Releases Q1 2016 Earnings, Forecasts Improvements Due to New Operating Structure

![]() Amidst all the euphoria and almost magical energy surrounding 3D printing recently, there was bound to be a fall somewhere; and while indeed there has been in terms of financial reports being issued by 3D printing industry titans over at least the past year, this is confusing to many. As one innovation after another is churned out, and revolutions are proclaimed to be happening in nearly every sector from medical to automotive to fashion—and far beyond—why do the biggest companies seem to be faltering while so many other smaller, often international ones, are dancing with delight over financials?
Amidst all the euphoria and almost magical energy surrounding 3D printing recently, there was bound to be a fall somewhere; and while indeed there has been in terms of financial reports being issued by 3D printing industry titans over at least the past year, this is confusing to many. As one innovation after another is churned out, and revolutions are proclaimed to be happening in nearly every sector from medical to automotive to fashion—and far beyond—why do the biggest companies seem to be faltering while so many other smaller, often international ones, are dancing with delight over financials?
We must continue to ask that question even as we do see some light ahead in viewing first quarter 2016 financial results for the mega-manufacturer of 3D printing solutions, Stratasys, headquartered in Minneapolis, Minnesota and Rehovot, Israel. While Non-GAAP net income for the first quarter was $0.6 million, or $0.01 per diluted share, compared to non-GAAP net income of $2.0 million, or $0.04 per diluted share, reported for the same period last year, the powers that be at Stratasys recommend viewing their progress in terms of operating profit growth, as that is what they project as offering the best performance measurement for this year.
Q1-2016 Financial Results Summary:
- Revenue for the first quarter of 2016 was $167.9 million.
- GAAP operating loss for the first quarter was $21.1 million, compared to a loss of $220.9 million for the same period last year.
- Non-GAAP operating income was $4.0 million, compared to a loss of $0.8 million for the same period last year.
- GAAP net loss for the first quarter was $23.1 million, or ($0.44) per diluted share, compared to a loss of $216.3 million, or ($4.24) per diluted share, for the same period last year.
- Non-GAAP net income for the first quarter was $0.6 million, or $0.01 per diluted share, compared to non-GAAP net income of $2.0 million, or $0.04 per diluted share, reported for the same period last year.
- The Company generated $31.6 million in cash from operations during the first quarter, and currently holds approximately $280.2 million in cash and cash equivalents and short-term bank deposits.
- The Company invested a net amount of $22.8 million in R&D projects (non-GAAP basis) during the first quarter, representing 13.6% of net sales.
- Non-GAAP EBITDA for the first quarter amounted to $12.6 million.
- The Company sold 5,125 3D printing and additive manufacturing systems during the quarter, and on a pro-forma combined basis, has sold a total of 151,149 systems worldwide as of March 31, 2016.
“Although the overall market environment remains challenging, we made significant progress in improving our operating efficiency during the first quarter, which is demonstrated by the favorable trends we observed in operating expenses and cash generation during the period,” said David Reis, chief executive officer of Stratasys. “We believe the recent refinements to our operating structure will make us more productive and better position us for future growth.”

The new Stratasys J750 3D printer allows for more than 360,000 color combinations.
There has been great positive excitement around the release of the Stratasys J750 3D printer, for which 3DPrint.com was in attendance at the OtterBox headquarters in Fort Collins, Colorado. This should continue to be a major boon for business as it allows users so many more options with full-color and multi-material capabilities. Seeing this as another reinvention for 3D printing, the J750 3D printer is the one that’s really meant to do it all for streamlining workflow, offering much better speed and turnaround, and doubling capabilities while offering a color palette of over 360,000 colors.
Continued operational improvement initiatives have been underway, and as we reported recently, this includes outsourcing of MakerBot desktop 3D printer production to Jabil.
We’ve also been following the new Thingiverse Developer Program, which has just recently been launched, expanding the platform’s functionality by allowing developers to create apps in three different categories: print services, model customization and tools and utilities. It also includes includes documentation, resources, and enrollment for developers and gives instruction for developers regarding creating Thingiverse apps, submitting apps to MakerBot, as well as testing and managing apps and analytics.
Also making headlines was the announced agreement between Stratasys Direct Manufacturing (SDM) and Somos, a leading stereolithography materials provider, through which both parties will seek to accelerate materials development and provide SDM customers with a wider range of advanced material options. And in another development which we are following closely, Stratasys too announced the impending creation of a Center of Excellence in collaboration with the Jacobs Institute. Both companies will bring their considerable years of expertise together, along with 3D printing, to develop and test prototypes and models for the 3D printed medical devices of the future.
“As we transform our business, we are focused on investing for the future, which includes developing new technologies and innovative new products. The recent launch of the Stratasys J750, which offers unmatched color and multi-material printing capabilities, is a great example of that commitment,” continued Reis. “We are also excited about additional products we plan to launch in 2016. These products will support our long-term strategy to develop a comprehensive solutions-based business that targets new applications across key vertical markets. While our near-term visibility remains low, we believe our strategy and improved operating structure will position us for future success in our dynamic industry.”
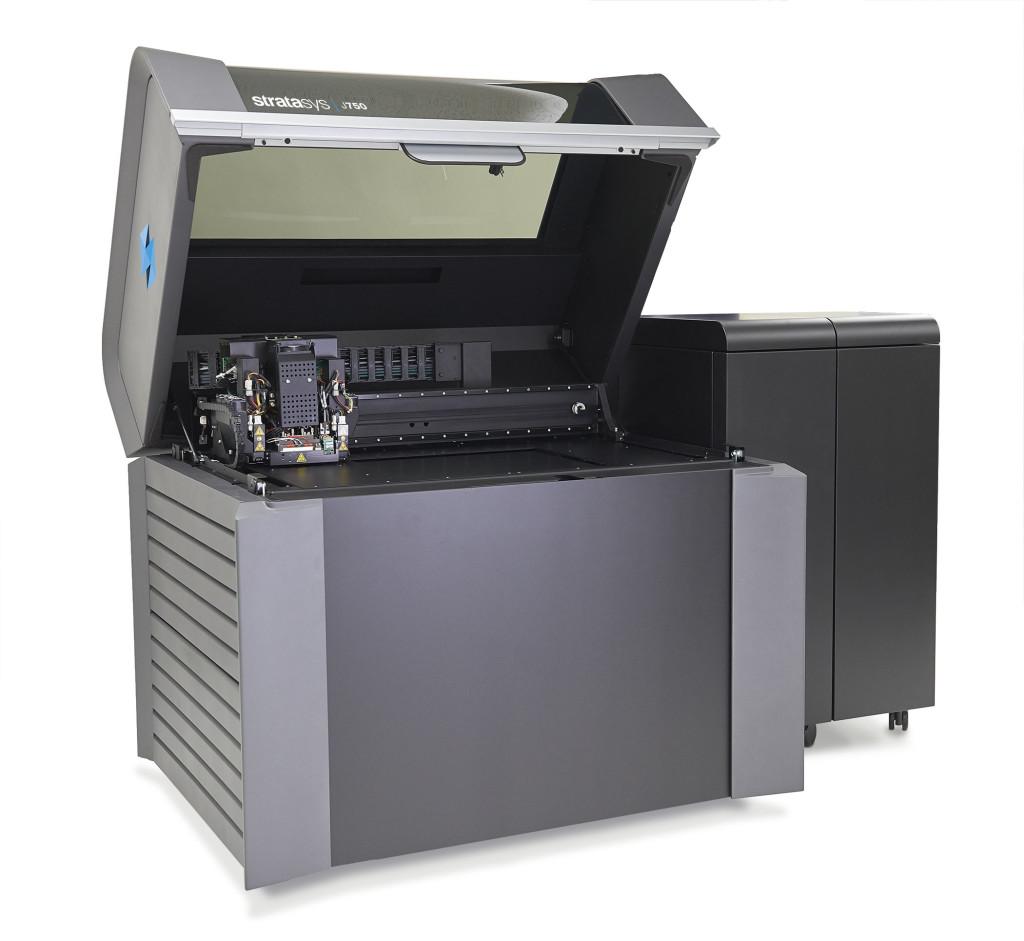
Stratasys J750 3D Printer
Stratasys provided the following information regarding the company’s projected revenue and net income for the fiscal year ending December 31, 2016:
- Revenue guidance of $700 to $730 million
- Non-GAAP net income of $9 to $23 million, or $0.17 to $0.43 per diluted share
- GAAP net loss of $84.0 to $67.0 million, or ($1.60) to ($1.28) per diluted share
Stratasys provided the following additional information regarding the company’s potential performance and strategic plans for 2016:
- Gross margins to improve modestly to a range of 54% to 55%
- Operating margins of 3% to 5%
- Tax expense of $10 to $11 million, which includes the negative impact of the planned accounting treatment for tax valuation allowance
- Capital expenditures are projected at $60 to $70 million, with approximately $45 million designated for completing the company’s new facility in Israel
Stratasys foresees an improvement in 2016 regarding their operating structure which will result in better operating profits this year. They recommend looking at those numbers, considering the ‘expected ongoing negative impact on net income of the planned accounting treatment for valuation of deferred tax assets.’ Also according to Stratasys, Non-GAAP earnings guidance excludes $59.0 million of projected amortization of intangible assets; $25.0 to $27.0 million of share-based compensation expense; $7.0 million in merger and acquisition related expense; $4.0 to $5.0 million in reorganization and other related costs; and includes $5.0 million in tax expenses related to non-GAAP adjustments.
See the table below for an itemized detail of the non-GAAP financial measures.
The company held a conference call and live webcast in regards to these financial results earlier today, May 9th, and the webcast will be available at Stratasys for 90 days. To gain access, click here. Discuss in the Stratasys First Quarter Report forum over at 3DPB.com.
| Consolidated Balance Sheets | ||||||||
| (in thousands, except share data) | ||||||||
| March 31, | December 31, | |||||||
| 2016 | 2015 | |||||||
| (unaudited) | ||||||||
| ASSETS | ||||||||
| Current assets | ||||||||
| Cash and cash equivalents | $ | 213,176 | $ | 257,592 | ||||
| Short-term bank deposits | 67,000 | 571 | ||||||
| Accounts receivable, net | 109,132 | 123,215 | ||||||
| Inventories | 124,479 | 123,658 | ||||||
| Net investment in sales-type leases | 12,833 | 11,704 | ||||||
| Prepaid expenses | 7,362 | 8,469 | ||||||
| Other current assets | 20,243 | 21,864 | ||||||
| Total current assets | 554,225 | 547,073 | ||||||
| Non-current assets | ||||||||
| Goodwill | 386,559 | 383,853 | ||||||
| Other intangible assets, net | 238,431 | 252,468 | ||||||
| Property, plant and equipment, net | 200,704 | 201,934 | ||||||
| Net investment in sales-type leases – long term | 18,569 | 17,785 | ||||||
| Deferred income taxes and other non-current assets | 14,313 | 11,243 | ||||||
| Total non-current assets | 858,576 | 867,283 | ||||||
| Total assets | $ | 1,412,801 | $ | 1,414,356 | ||||
| LIABILITIES AND EQUITY | ||||||||
| Current liabilities | ||||||||
| Accounts payable | $ | 37,549 | $ | 39,021 | ||||
| Accrued expenses and other current liabilities | 34,510 | 31,314 | ||||||
| Accrued compensation and related benefits | 41,380 | 34,052 | ||||||
| Income taxes payable | 11,951 | 11,395 | ||||||
| Obligations in connection with acquisitions | 5,058 | 4,636 | ||||||
| Deferred revenues | 52,031 | 52,309 | ||||||
| Total current liabilities | 182,479 | 172,727 | ||||||
| Non-current liabilities | ||||||||
| Obligations in connection with acquisitions – long term | 4,658 | 4,354 | ||||||
| Deferred tax liabilities | 14,694 | 16,040 | ||||||
| Deferred revenues – long-term | 8,463 | 7,627 | ||||||
| Other non-current liabilities | 24,571 | 22,428 | ||||||
| Total non-current liabilities | 52,386 | 50,449 | ||||||
| Total liabilities | 234,865 | 223,176 | ||||||
| Redeemable non-controlling interests | 2,281 | 2,379 | ||||||
| Equity | ||||||||
|
Ordinary shares, NIS 0.01 nominal value, authorized 180,000 thousands shares; 52,107 thousands shares and 52,082 thousands shares issued and outstanding at March 31, 2016 and December 31, 2015, respectively |
141 | 141 | ||||||
| Additional paid-in capital | 2,611,612 | 2,605,957 | ||||||
| Accumulated deficit | (1,429,847 | ) | (1,406,706 | ) | ||||
| Accumulated other comprehensive loss | (6,502 | ) | (10,774 | ) | ||||
| Equity attributable to Stratasys Ltd. | 1,175,404 | 1,188,618 | ||||||
| Non-controlling interest | 251 | 183 | ||||||
| Total equity | 1,175,655 | 1,188,801 | ||||||
| Total liabilities and equity | $ | 1,412,801 | $ | 1,414,356 | ||||
| Stratasys Ltd. | ||||||||
| Consolidated Statements of Operations | ||||||||
| (in thousands, except per share data) | ||||||||
| Three Months Ended March 31, | ||||||||
| 2016 | 2015 | |||||||
| (unaudited) | (unaudited) | |||||||
| Net sales | ||||||||
| Products | $ | 118,634 | $ | 126,667 | ||||
| Services | 49,272 | 46,064 | ||||||
| 167,906 | 172,731 | |||||||
| Cost of sales | ||||||||
| Products | 56,938 | 98,371 | ||||||
| Services | 29,799 | 28,272 | ||||||
| 86,737 | 126,643 | |||||||
| Gross profit | 81,169 | 46,088 | ||||||
| Operating expenses | ||||||||
| Research and development, net | 25,115 | 27,238 | ||||||
| Selling, general and administrative | 76,387 | 102,608 | ||||||
| Goodwill impairment | – | 150,400 | ||||||
| Change in the fair value of obligations in connection with acquisitions | 727 | (13,256 | ) | |||||
| 102,229 | 266,990 | |||||||
| Operating loss | (21,060 | ) | (220,902 | ) | ||||
| Financial income (expenses), net | 180 | (5,124 | ) | |||||
| Loss before income taxes | (20,880 | ) | (226,026 | ) | ||||
| Income taxes | 2,291 | (9,622 | ) | |||||
| Net loss | (23,171 | ) | (216,404 | ) | ||||
| Net loss attributable to non-controlling interest | (30 | ) | (116 | ) | ||||
| Net loss attributable to Stratasys Ltd. | $ | (23,141 | ) | $ | (216,288 | ) | ||
| Net loss per ordinary share attributable to Stratasys Ltd. | ||||||||
| Basic | $ | (0.44 | ) | $ | (4.24 | ) | ||
| Diluted | (0.44 | ) | (4.24 | ) | ||||
| Weighted average ordinary shares outstanding | ||||||||
| Basic | 52,098 | 50,956 | ||||||
| Diluted | 52,098 | 50,956 | ||||||
| Stratasys Ltd. | ||||||||||||||||||||||||
| Reconciliation of GAAP to Non-GAAP Results of Operations | ||||||||||||||||||||||||
| (in thousands, except per share data) | ||||||||||||||||||||||||
| Three Months Ended March 31, 2016 | Three Months Ended March 31, 2015 | |||||||||||||||||||||||
| GAAP | Non-GAAP | GAAP | Non-GAAP | |||||||||||||||||||||
| (unaudited) | Adjustments* | (unaudited) | (unaudited) | Adjustments* | (unaudited) | |||||||||||||||||||
| Net sales | ||||||||||||||||||||||||
| Products | $ | 118,634 | $ | – | $ | 118,634 | $ | 126,667 | $ | – | $ | 126,667 | ||||||||||||
| Services | 49,272 | – | 49,272 | 46,064 | – | 46,064 | ||||||||||||||||||
| 167,906 | – | 167,906 | 172,731 | – | 172,731 | |||||||||||||||||||
| Cost of sales | ||||||||||||||||||||||||
| Products | 56,938 | (10,836 | ) | 46,102 | 98,371 | (45,912 | ) | 52,459 | ||||||||||||||||
| Services | 29,799 | (442 | ) | 29,357 | 28,272 | (1,409 | ) | 26,863 | ||||||||||||||||
| 86,737 | (11,278 | ) | 75,459 | 126,643 | (47,321 | ) | 79,322 | |||||||||||||||||
| Gross profit | 81,169 | 11,278 | 92,447 | 46,088 | 47,321 | 93,409 | ||||||||||||||||||
| Operating expenses | ||||||||||||||||||||||||
| Research and development, net | 25,115 | (2,270 | ) | 22,845 | 27,238 | (2,817 | ) | 24,421 | ||||||||||||||||
| Selling, general and administrative | 76,387 | (10,738 | ) | 65,649 | 102,608 | (32,844 | ) | 69,764 | ||||||||||||||||
| Goodwill impairment | – | – | – | 150,400 | (150,400 | ) | – | |||||||||||||||||
| Change in the fair value of obligations in connection with acquisitions | 727 | (727 | ) | – | (13,256 | ) | 13,256 | – | ||||||||||||||||
| 102,229 | (13,735 | ) | 88,494 | 266,990 | (172,805 | ) | 94,185 | |||||||||||||||||
| Operating income (loss) | (21,060 | ) | 25,013 | 3,953 | (220,902 | ) | 220,126 | (776 | ) | |||||||||||||||
| Financial income (expenses), net | 180 | – | 180 | (5,124 | ) | – | (5,124 | ) | ||||||||||||||||
| Income (loss) before income taxes | (20,880 | ) | 25,013 | 4,133 | (226,026 | ) | 220,126 | (5,900 | ) | |||||||||||||||
| Income taxes | 2,291 | 1,276 | 3,567 | (9,622 | ) | 1,814 | (7,808 | ) | ||||||||||||||||
| Net income (loss) | (23,171 | ) | 23,737 | 566 | (216,404 | ) | 218,312 | 1,908 | ||||||||||||||||
| Net loss attributable to non-controlling interest | (30 | ) | – | (30 | ) | (116 | ) | – | (116 | ) | ||||||||||||||
| Net income (loss) attributable to Stratasys Ltd. | $ | (23,141 | ) | $ | 23,737 | $ | 596 | $ | (216,288 | ) | $ | 218,312 | $ | 2,024 | ||||||||||
| Net income (loss) per ordinary share attributable to Stratasys Ltd. | ||||||||||||||||||||||||
| Basic | $ | (0.44 | ) | $ | 0.01 | $ | (4.24 | ) | $ | 0.04 | ||||||||||||||
| Diluted | (0.44 | ) | 0.01 | (4.24 | ) | 0.04 | ||||||||||||||||||
| Weighted average ordinary shares outstanding | ||||||||||||||||||||||||
| Basic | 52,098 | 52,098 | 50,956 | 50,956 | ||||||||||||||||||||
| Diluted | 52,098 | 53,143 | 50,956 | 52,341 | ||||||||||||||||||||
|
The Company considers these non-GAAP measures to be indicative of its core operating results and facilitates a comparison of operating results across reporting periods. The Company uses these non-GAAP measures when evaluating its financial results as well as for internal planning and forecasting purposes, however these measures should not be viewed as a substitute for the Company’s GAAP results.
|
|
* Refer to the “Reconciliation of Non-GAAP Adjustments” herein for further information regarding adjustments. |
| Stratasys Ltd. | ||||||||
| Reconciliation of Non-GAAP Adjustments | ||||||||
| (in thousands) | ||||||||
| Three Months Ended March 31, | ||||||||
| 2016 | 2015 | |||||||
| Cost of sales, products | ||||||||
| Acquired intangible assets amortization | $ | (10,414 | ) | $ | (14,905 | ) | ||
| Acquired intangible assets impairment | – | (29,782 | ) | |||||
| Non-cash stock-based compensation expense | (362 | ) | (1,225 | ) | ||||
| Reorganization and other related costs | (60 | ) | – | |||||
| (10,836 | ) | (45,912 | ) | |||||
| Cost of sales, services | ||||||||
| Non-cash stock-based compensation expense | (361 | ) | (608 | ) | ||||
| Reorganization and other related costs | 280 | – | ||||||
| Merger and acquisition related expense | (361 | ) | (801 | ) | ||||
| (442 | ) | (1,409 | ) | |||||
| Research and development, net | ||||||||
| Non-cash stock-based compensation expense | (1,359 | ) | (1,868 | ) | ||||
| Merger and acquisition related expense | (911 | ) | (949 | ) | ||||
| (2,270 | ) | (2,817 | ) | |||||
| Selling, general and administrative | ||||||||
| Acquired intangible assets amortization | (3,760 | ) | (6,456 | ) | ||||
| Non-cash stock-based compensation expense | (3,541 | ) | (6,059 | ) | ||||
| Merger and acquisition related expense | (2,342 | ) | (6,906 | ) | ||||
| Reorganization and other related costs | (1,095 | ) | – | |||||
| Acquired intangible assets impairment | – | (13,423 | ) | |||||
| (10,738 | ) | (32,844 | ) | |||||
| Goodwill impairment | – | (150,400 | ) | |||||
| Change in the fair value of obligations in connection with acquisitions | ||||||||
| Change in the fair value of obligations in connection with acquisitions | (727 | ) | 13,256 | |||||
| Income taxes | ||||||||
| Corresponding tax effect and other tax adjustments | 1,276 | 1,814 | ||||||
| Net income | $ | 23,737 | $ | 218,312 | ||||
| Stratasys Ltd. | ||
| Reconciliation of GAAP to Non-GAAP Forward Looking Guidance | ||
| Fiscal Year 2016 | ||
| (in millions, except per share data) | ||
| GAAP net loss | ($84) to ($67) | |
|
Adjustments |
||
| Stock-based compensation expense | $25 to $27 | |
| Intangible assets amortization expense | $59 | |
| Merger and acquisition related expense | $7 | |
| Reorganization and other related costs | $4 to $5 | |
| Tax expense related to Non-GAAP adjustments | ($5) | |
| Non-GAAP net income | $9 to $23 | |
| GAAP loss per share | ($1.60) to ($1.28) | |
| Non-GAAP diluted earnings per share | $0.17 to $0.43 | |
Subscribe to Our Email Newsletter
Stay up-to-date on all the latest news from the 3D printing industry and receive information and offers from third party vendors.
Print Services
Upload your 3D Models and get them printed quickly and efficiently.


You May Also Like
3D Printing News Briefs, July 2, 2025: Copper Alloys, Defense Manufacturing, & More
We’re starting off with metals in today’s 3D Printing News Briefs, as Farsoon has unveiled a large-scale AM solution for copper alloys, and Meltio used its wire-laser metal solution to...
3DPOD 260: John Hart on VulcanForms, MIT, Desktop Metal and More
John Hart is a Professor at MIT; he´s also the director of the Laboratory for Manufacturing and Productivity as well as the director of the Center for Advanced Production Technologies....
3D Printing News Briefs, June 28, 2025: Defense Accelerator, Surgical Models, & More
In this weekend’s 3D Printing News Briefs, 3YOURMIND was selected to join an EU Defense Accelerator, and PTC has announced model-based definition (MBD) capabilities within Onshape. Finally, a study out...
EOS in India: AM’s Rising Star
EOS is doubling down on India. With a growing base of aerospace startups, new government policies, and a massive engineering workforce, India is quickly becoming one of the most important...