Variability of Additive Manufacturing Processes Part 3


This article is part of a series: Part One is here and Two is here.
Variability: Dimensional Measurements
In the context of accuracy versus precision, dimensional measurements can use mean (average) measurement values as a comparative gauge of accuracy. Unlike mechanical properties, the results of dimensional inspection are directly comparable since there is a common target, the nominal dimension specified in the design. And since the target is common, standard deviation (SD) comparison is a suitable gauge of precision. Ideally, for high confidence in the quality of the AM process’ output, the mean for the deviation from the nominal dimension and the SD should be very low. This study evaluated dimensional variances of five AM processes using six instances of a check part for each process. To understand any contribution to variance from machine-to-machine discrepancies, three of the check parts were constructed on Machine 1 and the balance on Machine 2. All data presented in the following tables and charts are based on the deviation from the nominal dimension. The threshold for allowable tolerances has been set to the greater of +/- 0.0035 in. or 0.0015 in./in., which is the most stringent target documented by equipment and service suppliers of these technologies. For additional details on the testing methodology, see Appendix. Note that CLIP has been excluded from the dimensional accuracy and precision analysis. To achieve the study’s goal of evaluating dimensional accuracy across the extents of the build area, the check part’s size exceeded the build area of the CLIP machine. Also note that FFF required post-build heating to remove warpage that impeded check part measurement.
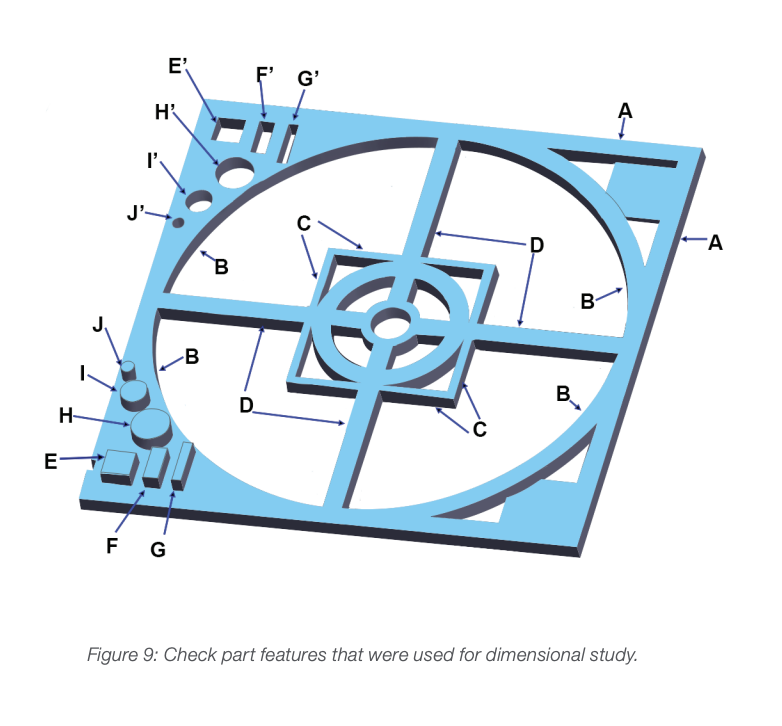
Check Part The selected check part, as shown in Figure 9, is 9 in. X 9 in. It includes a variety of positive features, such as bosses and ribs, and negative features, such as holes and slots. The analysis considered 19 features that were inspected through 43 measurements. To understand any influence of feature type or size, the following information is segmented into three categories: large features; small, positive features; and small, negative features. The large features, labeled A, B C, and D in Figure 9, were measured in multiple locations along both the X and Y axes. By combining six to eight measurements for each feature, the resulting mean value and SD provide an indication of overall accuracy and precision, independent of axis. Note that for features C and D, the dimensional analysis considered the wall thickness, not the overall size. The small features were mirrored and reversed to understand any difference between positive and negative feature accuracy while minimizing the effect of position within the AM machine. The small, positive features are located on the lower left of the check part. These are labeled in Figure 9 as E, F, G, H, I and J. To indicate the axes of measurement, each label for a rectangular feature has an ‘x’ or ‘y’ appended. The small, negative features are mirrored on the centerline of the check part (X axis) and located on the upper left.
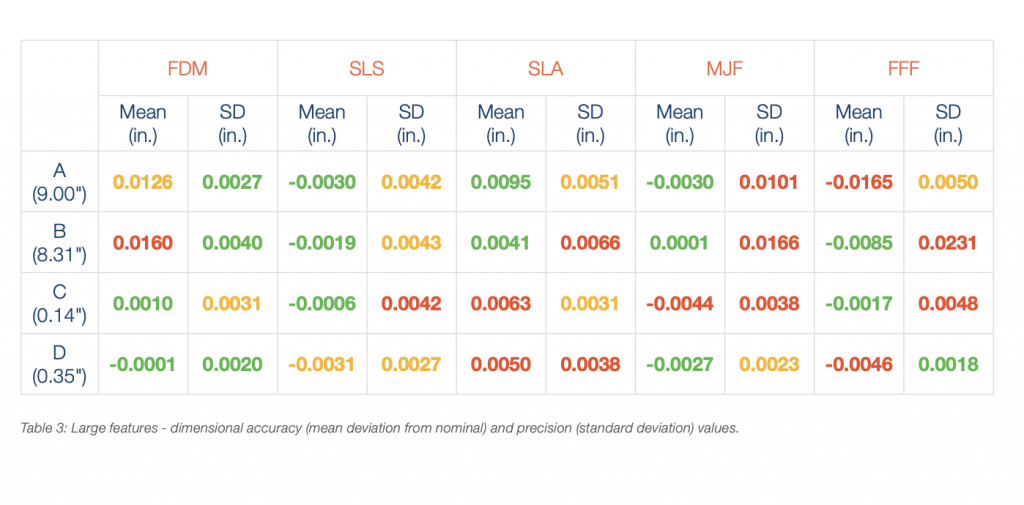
These features use the same labeling convention as that for the small positive features with the addition of a prime symbol (‘). Note that due to impediments to the CMM inspection routine, three measurements were omitted, H, G‘x and G‘y. Overall Results In testing, reliance upon meeting tolerance specifications may be misleading since it only considers accuracy. To characterize predictability, variability (SD) must also be considered. For example, an AM process with high precision but low accuracy can use adjustments to either the design or build parameters in order to achieve tolerance specifications with confidence. Conversely, an accurate but imprecise AM process may not achieve the same level of repeatable performance. The accuracy vs. precision matter becomes clear from the test results shown in Figures 10, 11 and 12. SLS and FFF were the AM processes with most features (12 each) falling within tolerance. However, both proved to be imprecise with a mix of SDs that ranged from very good to very poor. Conversely, SLA was inaccurate, with only two features being in tolerance, but it was precise, with six of the lowest SDs. MJF proved to be both inaccurate and imprecise. Meanwhile, FDM had the best combination of accuracy and precision with 11 in-tolerance features and 14 of the lowest SDs. The results for large features are shown in Figure 10 and Table 3. Figure 10, and all subsequent charts, plots the mean value of the deviation from the nominal dimension with a circle marker and +/- 1 SD with error bars. Additionally, the red lines indicate the tolerance band for the respective features.

Figure 10 shows that FDM was the most precise with SD’s ranging from 0.0020 in. to 0.0040 in. While the wall thickness measurements (C and D) were accurate, the largest features’ (A and B) dimensions approached or exceeded the upper tolerance limit. With three in-tolerance measurements, MJF was accurate for the largest features yet imprecise with SDs ranging from 0.0023 in. to 0.0166 in. SLS was the most accurate with mean values ranging from -0.0006 in. to -0.0031 in. while having reasonable precision (0.0027 in. to 0.0043 in.). For SLA, the results were mixed. SLA’s features C and D were inaccurate but reasonably precise (0.0031 in. and 0.0038 in.), yet features A and B were accurate but less precise (0.0051 in. and 0.0066 in.). FFF proved to be somewhat accurate, but its precision was the most varied, ranging from 0.0018 in. to 0.0231 in.
Subscribe to Our Email Newsletter
Stay up-to-date on all the latest news from the 3D printing industry and receive information and offers from third party vendors.
Print Services
Upload your 3D Models and get them printed quickly and efficiently.


You May Also Like
Excellent Desktop Injection Molding, Made in Italy by Robot Factory
I was captivated when I saw my first Robot Factory 3D printer. The robust, precise machine was built to last. And this was in an era of very flimsy, disposable,...
Pogačar & Fairlight Cycles Show Us Low Cost 3D Printed Components for Bikes
There has been a lot going on in 3D printing for bicycles over the years. The most successful implementation so far is in bicycle seats. Carbon 3D printed seats are...
3D Printing News Briefs, June 18, 2026: Reseller, Relocation, Metal Space Powder, & More
We’ll start with business news in today’s 3D Printing News Briefs, as XJet appointed a value-added reseller in Germany, BIO INX is expanding its presence in the Italian market, and...
Researchers Combine AI and Bioprinting to Create Tiny Blood Vessel Networks
If 2026 has a theme in bioprinting, it may be blood vessels. Researchers can already print incredibly sophisticated tissues. The harder part is keeping those tissues alive. Without a network...