
How Much Money Can I 3D Print per Minute?

When I look at 3D printing business cases, applications, and parts I often use profit velocity, also called the Du Pont Model or DuPont Analysis. For the Excel junkies, this is a way to optimize your product mix or look at your return based on the lens of cash generated per minute per operation. Or you can look at all of the production steps and see how many dollars you can make on each item on the whole. You can also calculate how many different channels or divisions within your business generate sales per minute.
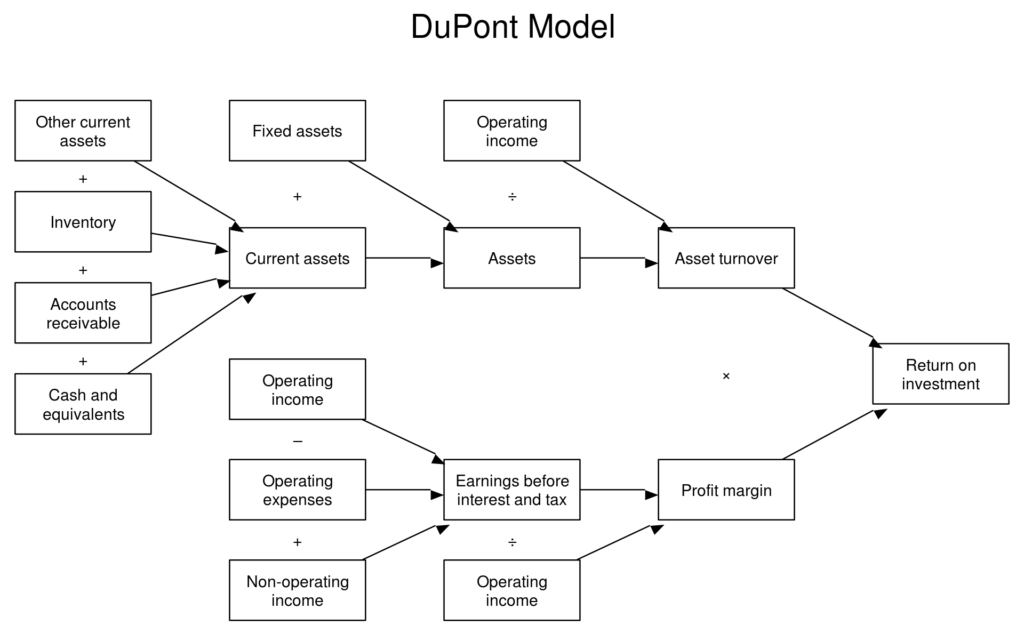
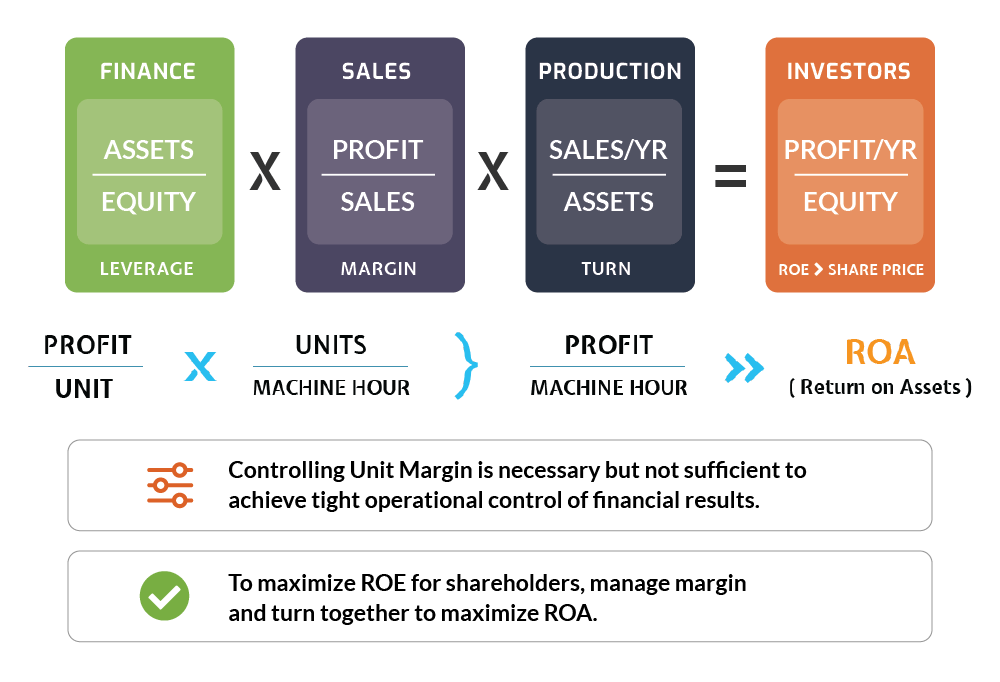
The idea is that you can focus on maximizing your return per product step, for your total product mix or your return on equity. Similar ways of looking at this are through contribution margin per hour per product in your product mix or per operation. Investors or management can also use the DuPont model to analyze performance by looking at return on equity and return on assets in a firm or in between firms.
For our purposes, we’re looking at how much cash per minute a 3D printer can generate. So, we’re using a similar model to look at the number of kilos of goods a 3D printer can make per minute of what type and what dollar amount we can get from that. What we want to do is optimize the type of things we 3D print and understand exactly how we can make the most cash with our individual printer or with the entire idea-to-part tool chain as a whole.
Some of these theories of constraints are fairly straightforward, intuitive even. You know that if you print an Eiffel Tower shape horizontally, it may take an hour, whereas the same shape printed vertically would take six. So, on the whole, this type of thinking is initially quite simple. But, even with this Eiffel tower example, we can see how complex this kind of thinking can get.
If we were to use material extrusion, we would need supports to print the Eiffel Tower horizontally. We then may only be able to use our single dual-nozzle system and not our other 100 single-nozzle printers. This will constrain the number of Eiffel Towers that we can make this way. At the same time, we may have spent significantly less on the single nozzle systems which would affect their cost per machine hour. So, an optimal production may include ten horizontal towers and 100 vertical ones. Or it may also be uneconomical to make them horizontally after all, since we will have to manually remove the support material. The support material may cause more errors than printing it without, so this could make the initially more expensive option less expensive in the long run.
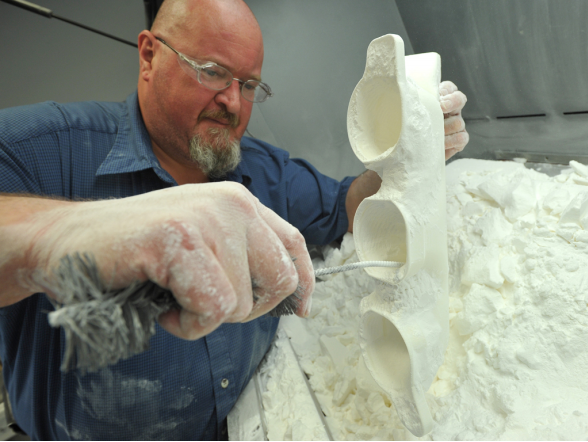
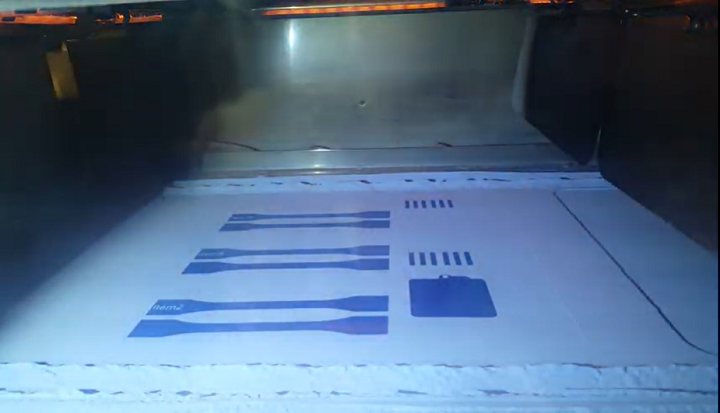
Figure 1. An operator removing powder from a 3D printed part (manual decaking).
At the same time, the overall thinking is that we can only print so much at any given moment. So perhaps Eiffel Towers are very expensive, but have high retail prices. But, if they take one hour each to make, they make actually not be very efficient. A Luxor Obelisk model, for example, may print in half the time. But the same Obelisk model uses four times the amount of material as our Eiffel tower. The Arc de Triumph uses more material than the Eiffel Tower, but, since it is shorter, it will print in 20 minutes. By now, you can see that this can get pretty complex pretty quickly.
Let’s look at the cash that parts can generate for us. We can print apples, which cost $4 and we sell for $5; oranges which cost $7 and sell for $10; grapes which cost $1 and sell for $2; and paperclips, which cost $1 and sell for $1.10. If you come from being revenue- or profit-motivated, you’re already found your favorites in the above list. If you love net contribution margin or you’re motivated by your VC friends, you’ll make and ideate different products with different cost structures.
Depending on your KPIs, you’ll think differently. Oranges may very well be able to get us the most revenue per item. But, if we sell one per day, our financial future will probably depend more on the 1,000 apples we sell that day. Meanwhile, if we would sell 1000 grapes instead of 1000 apples, we’d have a lot less revenue, but could use our own equipment and cash much more efficiently for a very high-profit item. However, we’d have to sell the same amount of apples at $5 or grapes at $2 to get the same profit per item than the same number of oranges to be as profitable.
What about the makability of these goods? If we can make 100,000 paperclips, 1,000 grapes, 100 apples or two oranges per minute, our thinking can change again. From the perspective of machine hour, we could do $10,000 a minute in paperclips, $1,000 in grapes, $100 in apples, and $6 in oranges. If, at later production steps, something takes longer to clean or requires more handling, it would change once again. We’d therefore have to come up with the best product mix based upon what we can sell and make per minute.
It gets even more complicated than that. Once I helped organize a party and inexplicably people drank on average two more alcoholic drinks per night than normal. One variable we could discover was that we did not have bitter lemon on hand that day. We did further experiments and every time we left out the bitter lemon, people drank more alcohol. Our dataset was not endless, however. It could have been a trend or coincidence. It could have been the humidity or a commercial on TV. Causality is very difficult and you’ll often make mistakes when trying to trace back to it.
Similarly, one product could attract new customers that are particularly profitable in the long run, while the product itself could not be that profitable. Famously, supermarkets have loss leaders such as baked beans or tinned tomato paste which lose them money while gaining them customers. You could notice that, once there are no apples, people buy a lot more of other fruit, or they may never return to you. So, you won’t be able to perfectly make the ideal product mix, but, thinking about how much you can make and sell per minute is an extremely insightful way to think about business choices and product mix.
For example, at a 3D printing service bureau, we looked at the total volume of all parts that were to be produced that week and then optimized all the builds that week, rather than optimize for just one machine that day. This significantly increased our throughput and profit overall. This may sound super simple, but others don’t do it.
Subscribe to Our Email Newsletter
Stay up-to-date on all the latest news from the 3D printing industry and receive information and offers from third party vendors.
Print Services
Upload your 3D Models and get them printed quickly and efficiently.


You May Also Like
Srini Kaza Discusses Strategically Scaling Align’s “Smile-Changing” 3D Printed Aligners
Align Technology‘s Invisalign is a revolutionary method to get you the smile you want through 3D printing. It is also a hugely popular process to go through, a $4 billion...
Analysis: Additive Manufacturing Strategies Spotlights Vertical Value Creation
A slowdown in the industry and particularly a tightening of access to capital following the additive manufacturing (AM) industry’s peak special purpose acquisition company (SPAC) phase in early 2021 is...
Department of Defense Awards PROTECT3D $1.3M for Custom 3D Printed Braces
Custom prosthetics company PROTECT3D has secured a $1.3M Department of Defense (DoD) Small Business Innovation Research contract to develop a platform for creating custom braces for soldiers. The PROTECT3D Platform...
AMS 2025 Highlights Big Changes in 3D Printing with Pivotal Speakers and Panels
2023 was filled with excitement around the potential mergers being pursued by industry stalwart Stratasys (Nasdaq: SSYS), leading to some of the most insightful conversations imaginable at Additive Manufacturing Strategies...