Interactive 3D Model Shows Detailed Topology of California’s Oroville Dam Before Spillway Damage
Sarah Saunders
The wonders of 3D modeling can help people create all sorts of things, including topographical maps and puzzles, like this TopoTopo puzzle from HUSH and a 3D printed map of Ireland, created using digital topographic data. 3D topographic models can also be extremely useful as teaching tools, like with these 3D printed volcano models. The idea was that people living in Mexico near the Popocatépetl volcano, or Popo, would be better able to understand the hazards of the area if they received hands-on experience with the volcano’s flow, instead of just looking at a flat map. More than 100 students at a village school were given hollow 3D printed models of the volcano, so they could be used as molds to create plaster models for each student. Then, the students used syringes to squirt out red liquid onto the peaks, and watch the liquid, simulating the lava from the volcano, flow down the sides. An interactive 3D model of California’s Oroville Dam was recently uploaded to 3D content website Sketchfab, a popular online platform where users can share and view 3D models.
The Oroville Dam, the tallest dam in the nation and California’s second-largest reservoir, has been in the news a lot this month: last Sunday, February 12th, nearly 190,000 people were evacuated from counties that are located downstream of the dam, as officials were extremely concerned that the spillway would fail, and thousands of gallons of water would rush downstream. This month, the spillway at the Oroville Dam, which was built in the 1960s, was subjected to “massive volumes” of rain water, and the aged concrete has not always been repaired adequately when it developed cracks, leading to questions about the design integrity of the dam. The spillway has also slid downhill in the past, which opens up surface gaps, and the prior drought caused the underlying soil to shrink, so all of the recent rain water had plenty of underground fissures to fill. The Los Angeles Times quoted a retired dam engineer who called the damage to the spillway “an accident waiting to happen.”
Reduced water releases at the Oroville Dam have made damage to its main spillway more visible. [Image: Marcus Yam, Los Angeles Times]
The real trouble began on February 7th, when the main concrete spillway’s gates were opened and started breaking apart, which allowed 55,000 cubic feet of water/second to gush down the slope, eventually digging a huge hole in the terrain 45 feet deep. The spillway is not part of the dam: it’s actually an extremely important safety system at the site, and must be strong enough to hold up under extremely intense forces when the reservoir is filled to capacity by storms. Robert Bea, a retired civil engineering professor at UC Berkeley who was in charge of one of the Hurricane Katrina investigations into the levee system of New Orleans, told the LA Timesthat the “dead weight of the water alone was more than 5 tons per square foot.”
Work continues on the area below the Oroville Dam emergency spillway. [Image: Florence Low, California Department of Water Resources]
Luckily, according to The Mercury News, the water elevation behind the Oroville Dam has continued to drop. The California Department of Water Resources set a goal of 850 feet, and as of Sunday morning, February 19th, the reservoir’s elevation was at 852 feet, down nearly 50 feet since the water started flowing over the emergency spillway eight days prior.
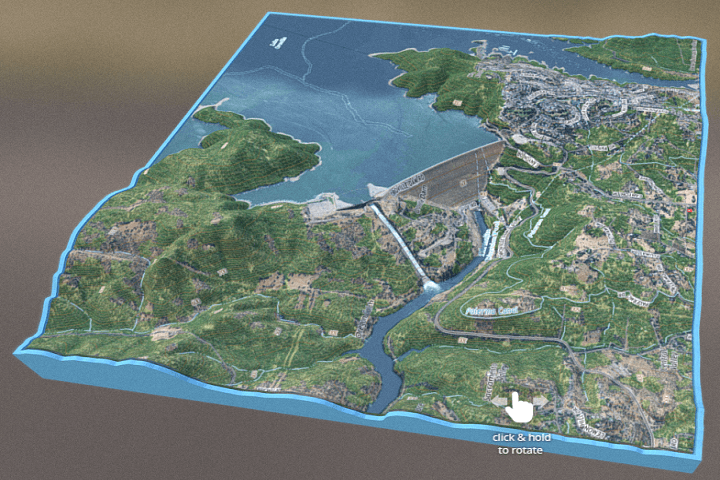
The overlayed map is from USGS 1:24K. The data is the USGS NED 10 ft. The map measures 19,5 cm wide
To remember how the man spillway looked before the hole was torn into it, the Earth Observation Sciences & Geographic Information Systems S.L (EOSGIS S.L.) created a 3D model of the Oroville Dam and the surrounding area, and published it on Sketchfab. EOSGIS, which is headquartered in Madrid, has been a member of Sketchfab for about a year, and has published other topographical 3D models, including one of the Leeds area.
EOSGIS integrates data with GIS, along with any other information or maps it’s provided with, to create custom cartography. They specialize in 3D terrain visualization, making an initial analysis of the terrain and the data, in order to display information like rivers, roads, and vegetation, onto a 3D representation with a realistic finish. This would be especially helpful for use in urban planning, architecture, and civil engineering.
This is a perfect example of how a 3D model can really help people visualize the entire scope of natural disasters and other events. You can’t get the same kind of visualization just by looking at a flat, two-dimensional map: the level of detail on this model is pretty impeccable. The closer you zoom in, the more detail you’re able to see, which could be a big help for everyone from rescuers looking for a way to get to people who need help, to engineers trying to rebuild. Discuss in the Oroville Dam forum at 3DPB.com.

![Reduced water releases at the Oroville Dam have made damage to its main spillway more visible. [Image: Marcus Yam, Los Angeles Times]](https://editorial.3dprint.com/wp-content/uploads/2017/02/lake-oroville-spillway-pictures.jpg/)


